I’ll be blunt—if you’re reporting optimization results without KPIs, you’re not really reporting. You’re guessing. And guessing doesn’t get buy-in from clients or the C-suite.
Metrics are how I validate what’s working, what’s underperforming, and where to dig deeper. Whether it’s technical work, content strategy, or a backlink push, I need numbers that actually tell a story.
In this post, I’ll walk you through the performance indicators I use in every reporting process—whether I’m troubleshooting an issue or showing off a win.
What You’ll Learn (Quick Snapshot)
- The metrics I track (and why)
- Tools I use to report cleanly and clearly
- Which numbers reflect actual business value—not just “pretty charts”
- What not to waste time tracking
- Tips to report without overselling (or underselling) your efforts
Organic Conversions
If there’s one metric clients actually care about, it’s this.
Organic conversions show how well your efforts drive real action—like sign-ups, purchases, form fills, or resource downloads. It’s what turns “traffic” into “results.”
In GA4, I mark key actions as conversions. It gives me clean, trackable data to share without the guesswork.
Need a refresher on how this fits into broader diagnostics? My SEO audit guide walks you through the bigger picture.
Visibility Across Search Results
I don’t just care if a page is on page one. I want to know how often it shows up for searches overall.
Using Google Search Console and position tracking tools, I measure total impressions across key queries. If visibility drops, I dig into whether it’s technical, content-related, or a change in how search features display (hello, featured snippets).
If this metric isn’t in your monthly reports, you’re missing the bigger story.
Visitors from Organic Channels
Not all traffic is good traffic—but when people are clicking through from organic listings, I pay attention.
Here’s what I track:
- Number of visits from search
- Top-performing entry pages
- Geographic breakdown
- Device distribution
This data helps me understand intent, behavior, and whether targeting is hitting the mark.
Click-Through Rate (CTR)
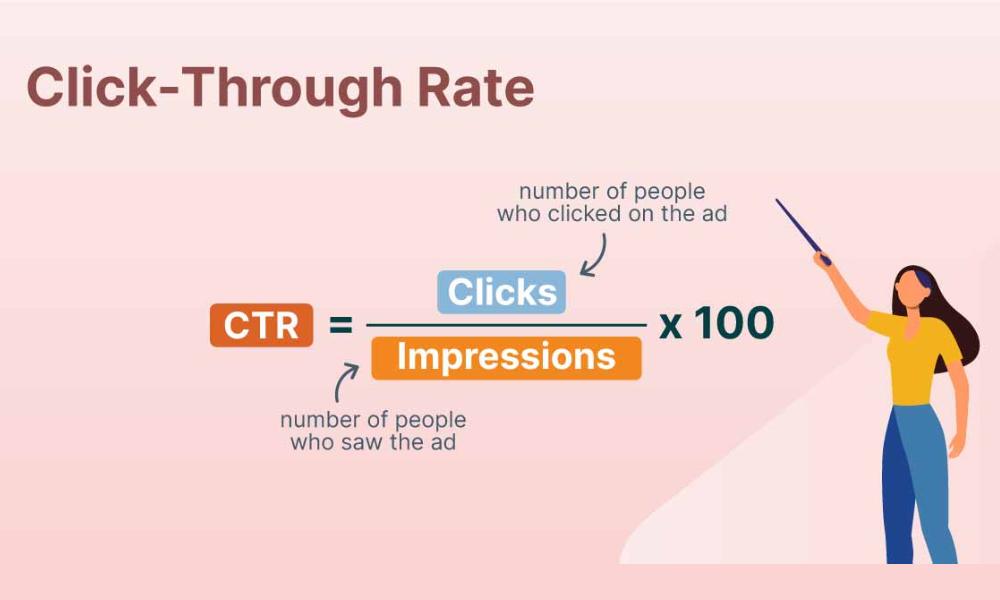
CTR shows whether people like what they see—at least enough to click.
I use GSC to track CTR by page and query. If the numbers are low, that’s usually a cue to refine titles and meta descriptions. Sometimes small changes make a big difference.
Pro tip: CTR is one of the fastest performance wins if you’re short on time or dev resources.
Position Changes for Targeted Terms
I track rankings, sure. But I don’t panic over every dip or spike.
I’m watching:
- Shifts for target terms
- Movement for new keyword opportunities
- Visibility across SERP features
Paired with your technical review, these insights help you understand whether content or structure is dragging things down. My go-to approach? I use the steps in this technical vs content audit guide to troubleshoot effectively.
Authority Signals (Backlinks)
Links tell a story of credibility.
But more isn’t always better. I’m watching:
- Total referring domains
- Ratio of new vs. lost links
- Spam flags and disavow opportunities
A solid link from a high-authority domain beats 20 from unknown blogs. Always.
User Interaction Signals
If people land on your site and leave after five seconds, we have a problem.
I use GA4’s engagement reports to track:
- Bounce rate
- Time spent on page
- Scroll depth
- Pages per visit
Combined, these tell me if content is doing its job—or just taking up server space. When these metrics look off, I revisit structure, load time, or clarity.
(Also: this is where my SEO checklist comes in handy.)
Lifetime Value of Acquired Users
Not all conversions are equal.
If one client brings in $1500 over 5 years, I track where they came from. That’s usually content that does more than just attract traffic—it attracts the right kind.
To estimate this value, I multiply:
- Average order size
- Repeat purchase rate
- Customer lifespan
Knowing this lets me prioritize content and keyword sets that attract better leads.
Cost per Acquisition
No sugarcoating it—if you’re spending $4000/month on optimization but getting only 20 leads, something’s off.
I calculate CPA like this:
Total Cost / Conversions = Cost per Acquisition
This includes tools, salaries, freelancers—everything. If it starts rising, I drill into funnel efficiency.
It’s not glamorous, but it’s honest. And when clients ask about ROI? This number has answers.
Non-Branded Search Visitors
This is my personal favorite indicator of long-term impact.
Branded searches come from people who already know you. But non-branded traffic? That’s reach. That’s new audience. That’s growth.
I compare branded vs. non-branded splits using tracking tools and work to improve the non-branded share over time.
ROI from Organic Channels
Here’s the one leadership really wants.
If I’m spending $5K/month and bringing in $12K in revenue, I don’t need to explain much more. But calculating that correctly takes time.
I track revenue via conversions and apply attribution models where I can. Then I subtract costs and run the simple math:
(Revenue – Cost) / Cost x 100 = ROI %
When this number’s positive? I screenshot it for the client deck.
Metrics from Google Business Profiles
If the business has a physical location, I’m checking GBP.
Here’s what I look for:
- Search views
- Direction requests
- Phone call clicks
- Reviews and engagement
Local presence matters—and this data often gets overlooked in bigger reports. Don’t sleep on it.
Final Thoughts
KPIs are my GPS. They keep my reports sharp and my strategy focused.
Are all of them necessary for every project? Nope. But the right mix depends on your goals, audience, and how mature the website is.
If you’re still sending monthly updates full of charts but no real insight, it might be time to rethink your framework.
Start small. Pick 4–5 metrics. Track consistently. And if you want help structuring all of it, my monthly SEO report guide can help you clean up the chaos.