Digital marketing isn’t just about creativity and clever copy. It’s about performance—and performance is measured in numbers. But not all numbers are worth tracking.
You don’t need 37 metrics on a dashboard to prove your campaign is working. You need the right KPIs—the ones that tell you whether your strategy is doing what it’s supposed to do.
I’ve worked with clients across industries, and regardless of the channel or goal, these 10 KPIs come up again and again. They’re not just vanity stats. These are the indicators I use to assess health, performance, and impact in any digital campaign.
What You’ll Learn in This Guide
- The 10 most actionable KPIs I use in almost every campaign
- Why these metrics matter more than “likes” or “clicks”
- How to connect each KPI to your marketing funnel
- Which tools and tracking methods I recommend
- Bonus tips to avoid common KPI misfires
Before You Start: One KPI Rule I Always Follow
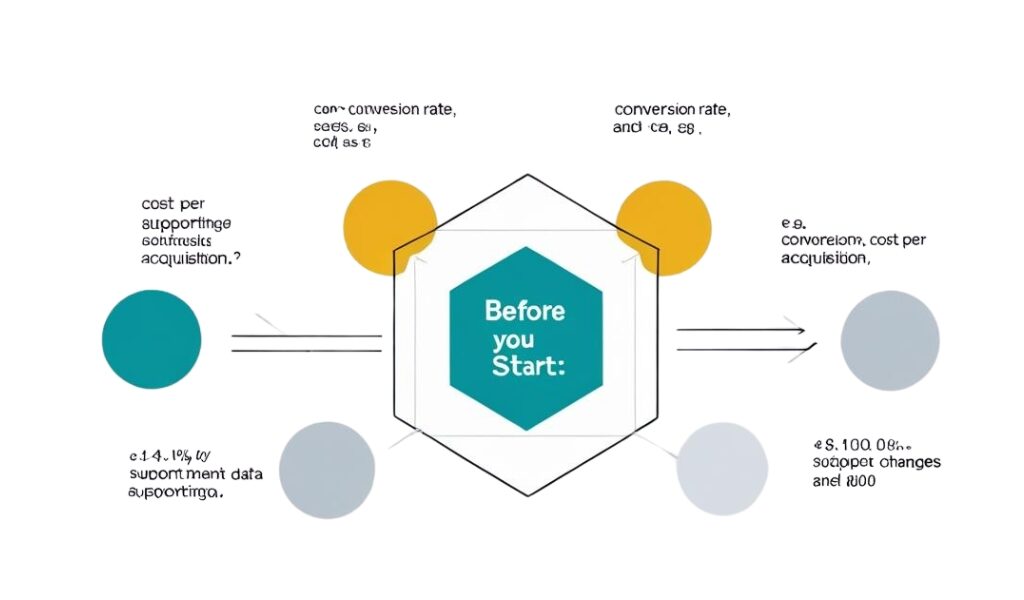
Every KPI should answer one question:
“If this number changes, would we change something about our strategy?”
If the answer is no, it’s not a KPI—it’s just a metric. Keep that in mind as we go through this list.
1. Conversion Rate (CVR)
What it is: The percentage of users who complete a desired action (purchase, sign-up, form submit)
Why it matters: It tells you if your traffic is doing what you want it to do.
Where I track it: Google Analytics (GA4), CRM, platform-specific tools (e.g., Shopify)
Track it by campaign, landing page, and device type to spot friction fast.
2. Cost Per Acquisition (CPA)
What it is: How much it costs to get one paying customer or lead
Why it matters: It tells you whether your campaigns are cost-effective
Where I track it: Google Ads, Meta Ads Manager, analytics dashboards
Combine with LTV (lifetime value) to understand return on ad spend.
3. Return on Ad Spend (ROAS)
What it is: Revenue generated for every dollar spent on ads
Why it matters: If ROAS is below 1.0, you’re losing money.
Where I track it: Ad platforms, Google Analytics, eCommerce platforms
Break it down by channel and creative to optimize high-performers.
4. Click-Through Rate (CTR)
What it is: Percentage of users who clicked on a link or ad after seeing it
Why it matters: High CTR = compelling message or offer
Where I track it: Ad platforms, email platforms, social tools
Use it as a signal—strong CTR with poor conversion? You’ve got a landing page problem.
5. Customer Lifetime Value (CLV / LTV)
What it is: The average revenue a customer generates over their lifecycle
Why it matters: Helps you understand how much you can spend to acquire them
Where I track it: CRM, analytics tools, eCommerce platforms
Match this against your CPA to decide if you’re scaling profitably.
6. Qualified Leads (MQLs/SQLs)
What it is: Leads that meet your ideal customer profile and are ready for sales
Why it matters: Not all leads are created equal
Where I track it: HubSpot, Salesforce, lead scoring tools
Define “qualified” clearly with your sales team. Track by source and campaign.
7. Bounce Rate / Engagement Rate
What it is: How quickly users leave your site without taking action
Why it matters: High bounce often signals poor content or offer mismatch
Where I track it: Google Analytics 4 (engagement metrics), heatmaps (e.g., Hotjar)
Use it alongside time on page and scroll depth for more clarity.
8. Email Open & Click Rates
What it is: Measures how engaging your subject line and content are
Why it matters: Email is still one of the highest-ROI channels
Where I track it: ESPs (Klaviyo, Mailchimp, HubSpot)
Segment your audience and test to improve steadily.
9. Social Engagement Rate
What it is: Ratio of interactions (likes, shares, comments) to followers or impressions
Why it matters: High engagement means your content resonates
Where I track it: Social platforms, tools like Buffer or Sprout
Vanity likes don’t matter. Engagement that leads to action does.
10. Traffic by Source/Medium
What it is: Where your visitors are coming from
Why it matters: Helps you prioritize and invest in top-performing channels
Where I track it: Google Analytics, UTM tracking, CRM
Look beyond volume—what’s driving the best quality traffic?
Bonus KPI: Funnel Completion Rate
What it is: How many users move from one stage of your funnel to the next
Why it matters: Shows you where prospects are getting stuck
Where I track it: GA4 (Exploration reports), custom dashboards
Combine this with tools like Google Tag Manager to monitor micro-conversions.
How to Track These KPIs the Smart Way
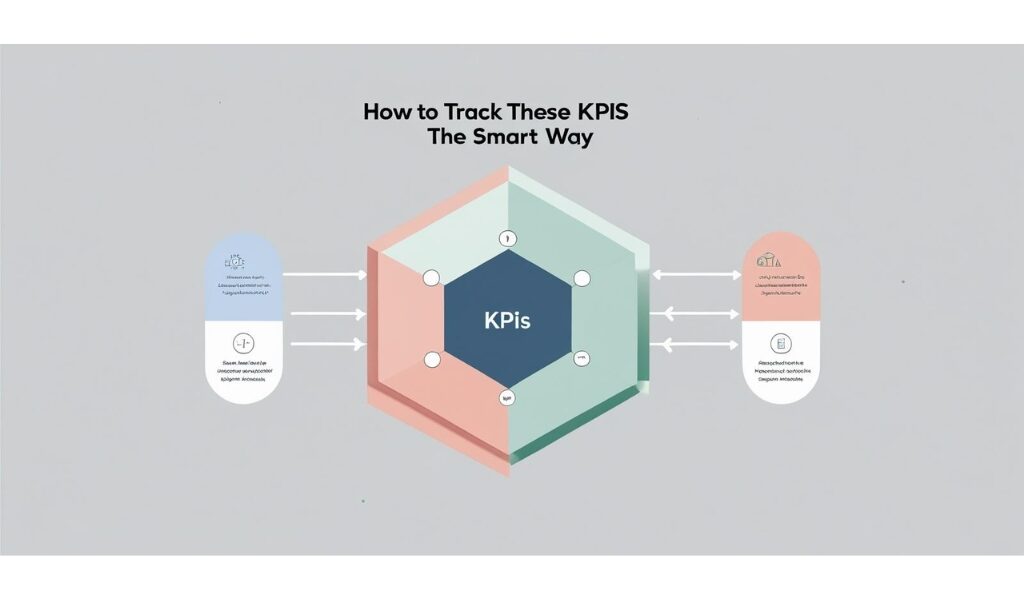
You don’t need 10 dashboards to track 10 KPIs. Here’s what I recommend:
Tools I use most often:
- GA4 + Google Tag Manager
- HubSpot or CRM (for lead and deal tracking)
- Looker Studio (for KPI dashboards)
- Supermetrics (to pull in campaign data)
- Heatmaps (Hotjar or Clarity)
Not sure which tools are right for you? Start with my tracking tools guide.
What Not to Track (Unless You Have a Plan for It)
Let’s cut the fluff. Here are a few “metrics” I see too often:
- Impressions without context
- Pageviews with no goal
- Time on site (without knowing what they’re doing there)
- Follower count (unless you’re monetizing it)
If a number looks impressive but doesn’t change your behavior—it’s a distraction.
Final Thoughts
Every great campaign has a clear set of goals—and those goals should have clear KPIs attached to them. Not guesses. Not “we’ll check it later.” Real numbers that help you know what’s working and what to fix.
If you’re launching or optimizing a campaign right now, start simple:
- Pick 3–5 KPIs from this list
- Set up tracking using GA4, your CRM, or reporting tool
- Review weekly, optimize monthly, and align with your goals
Tracking everything doesn’t make you data-driven. Tracking the right things does.