Most marketing teams know what their customers do—click, bounce, convert—but few understand why they do it.
They have dashboards full of data, but no real clarity. What’s missing is context.
That’s where mapping customer behavior across channels becomes the difference between marketing that just runs and marketing that actually performs.
If you’ve ever asked, “Why are people dropping off here?” or “Which touchpoints are actually working?”, this guide is for you. I’ll walk you through how I map customer behavior across platforms and use those insights to optimize messaging, timing, and experience.
What You’ll Learn in This Guide
- What behavior mapping means (and why it’s more than tracking clicks)
- Why it’s essential for omnichannel strategy
- How to gather the right data (and ignore the noise)
- My step-by-step process for mapping behavior
- What to do once you’ve got the map
What Is Customer Behavior Mapping?
Customer behavior mapping is the process of identifying and analyzing how people interact with your brand across all touchpoints—from first click to post-purchase follow-up.
But this isn’t about static funnels. This is about dynamic, cross-channel patterns that show:
- What channels bring people in
- What actions they take at each stage
- Where momentum builds (or breaks)
- Which behaviors predict conversion—or abandonment
The goal isn’t just to track. It’s to understand. And then improve.
Why It’s Essential in an Omnichannel Strategy
Omnichannel marketing isn’t linear—and neither are customer journeys. One person might:
- Discover your brand on Instagram
- Watch a YouTube review
- Browse your site on mobile
- Sign up via email on desktop
- Purchase two weeks later from a retargeting ad
If you’re not mapping how they move, you’re marketing in the dark.
Behavior mapping:
- Reveals how different platforms influence each other
- Highlights what actually drives decisions (not just what gets credit)
- Helps personalize the experience based on real actions
You can’t build a seamless customer journey if you don’t know what that journey looks like in the first place.
Need help setting up that broader structure? Start here:
The Step-by-Step Process to Map an Omnichannel Customer Journey
Step 1: Choose the Right Behavior Metrics to Track
Not all data is useful. Focus on actions that indicate interest, intent, or friction.
Here’s what I usually track across key channels:
Website:
- Pages viewed per session
- Time on page
- Scroll depth
- Clicks on CTAs
- Exit rates per page
Email:
- Open rates (yes, still helpful)
- Click-through rates
- Conversions per email
- Unsubscribes per campaign
- Engagement over time
Social Media:
- Engagement by content type
- Clicks to site
- Follower growth by campaign
- Saved or shared posts (signals of intent)
Ads:
- CTR by creative/message
- Landing page bounce rate
- Post-click journey (what they do next)
- Time to conversion
Support & Chat:
- Common questions asked
- Time to resolution
- Channel used for support (email, chat, social)
- Drop-off before ticket is submitted
You don’t need to track everything. You need to track what matters—and what you can take action on.
Step 2: Gather Data from All Key Channels
To map behavior properly, you’ll need a mix of:
- Quantitative data (what they did)
- Qualitative insight (why they did it)
Here’s how I usually collect both:
Tools for Quantitative Data:
- Google Analytics 4 – Web traffic, conversion paths, drop-off points
- Hotjar / Microsoft Clarity – Session recordings, heatmaps
- CRM (HubSpot, Salesforce) – Contact activity, lifecycle stages
- Email platforms (Klaviyo, Mailchimp) – Engagement by segment
- Paid ad platforms – Post-click behavior, not just CTR
Tools for Qualitative Insight:
- On-site polls – Ask: “What stopped you from buying today?”
- Customer interviews – 20-minute calls uncover more than 200 data points ever will
- Support chat logs – Goldmine for objections and confusion
- Social listening tools – What people are saying publicly
Don’t just look at behaviors in silos. The magic is in how these signals connect across platforms.
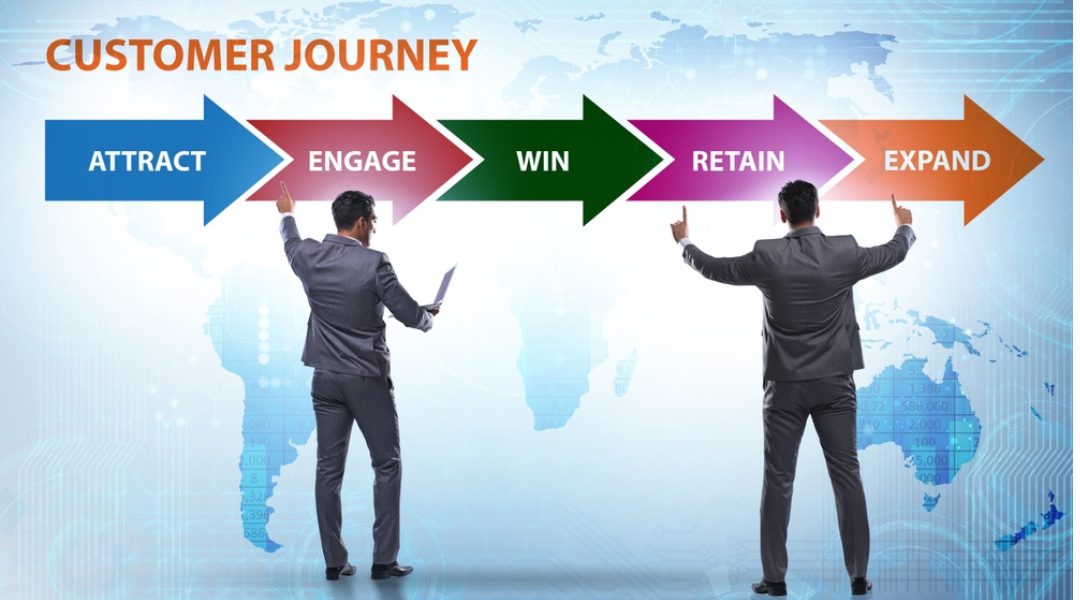
Step 3: Organize Behavior by Journey Stage
Now that you’ve gathered data, sort it by journey stage. I use this structure:
1. Awareness
- What platforms bring people in?
- What content sparks the first visit?
- What messages generate curiosity?
2. Consideration
- What pages or resources do they explore?
- What content do they return to?
- What questions do they ask?
3. Decision
- Do they visit pricing or product comparison pages?
- Do they reach out or add to cart?
- What objections surface before converting?
4. Post-Purchase
- Do they engage with onboarding or support?
- Do they return?
- Do they leave reviews or refer others?
Mapping behavior by stage makes it actionable. You see what’s working, what’s stalling, and where you can guide better.
Step 4: Identify Patterns, Gaps, and Opportunities
This is where mapping turns into insight.
Ask:
- Where are people falling off?
- Which actions most often lead to conversion?
- Are there missed moments to re-engage?
- Are some channels doing all the heavy lifting?
Examples:
- If users bounce after hitting your FAQ page, the content might not be answering real questions.
- If return visits spike after people read your case studies, feature them earlier in the journey.
- If mobile users consistently drop off at checkout, fix that flow—fast.
These aren’t just data points. They’re signals from your audience.
Step 5: Translate Behavior into Strategic Improvements
Once you’ve mapped behavior and spotted opportunities, turn that insight into action.
Examples of What You Might Do:
- Retarget visitors who spent more than 2 minutes on your product page but didn’t convert
- Revise your onboarding email for users who opened but didn’t click
- Test alternate offers for audiences who click ads but bounce from the landing page
- Create personalized experiences for users returning from specific content sources
- Trigger live chat for users stuck on the pricing page
You don’t need to change everything. Just the right things, based on real behavior.
Bonus: Map Behavior by Segment, Not Just Funnel
Funnel stages are useful, but not everyone moves the same way.
Segment your behavior analysis by:
- First-time visitors vs. returning users
- Subscribers vs. non-subscribers
- Organic traffic vs. paid clicks
- Mobile vs. desktop
- High-LTV customers vs. one-time buyers
This helps you build journeys that match how people actually behave—not just how your funnel is labeled.
Real Example from a Client Project

A B2C client was running multiple campaigns across paid social, email, and influencer channels. Traffic was strong—but conversion rates were stuck.
After mapping behavior:
- We noticed that visitors from influencer content spent longer on site but converted less.
- Hotjar showed they were scrolling but not clicking CTAs.
- Surveys revealed confusion about what the brand actually offered.
We adjusted the messaging on those specific landing pages, clarified the value proposition, and tested shorter CTAs.
Result: 38% lift in conversions from that segment in 3 weeks.
That’s the power of connecting behavior to action.
Final Thoughts
Mapping customer behavior across channels isn’t just about collecting more data—it’s about creating a clearer picture of what your customers actually want, and where you’re helping (or hindering) their progress.
When you understand how people move, what they need at each step, and where the experience breaks, you can build marketing that meets them where they are—and moves them forward.Ready to turn your data into decisions? Start here:
Mapping Customer Behavior Across Channels